
Quantifying Regional Trade Pathways.
Detailed analytics and trade metrics captured across the Singaporean corridor. We prioritize raw volume tracking and growth benchmarks to provide a baseline for market entry and expansion strategies.
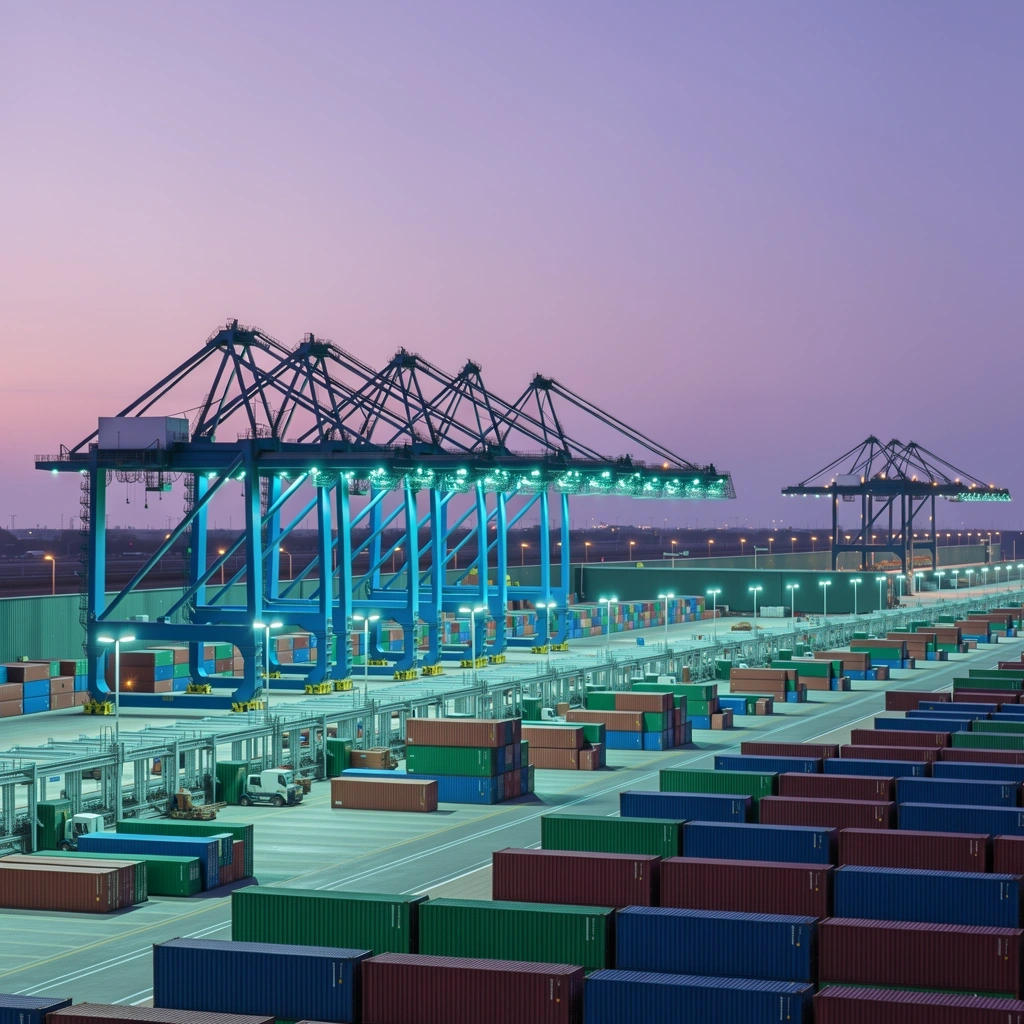
Maritime Volume
Total container throughput recorded at regional terminals as of March 2026.
Export Index
Growth analytics showing a steady increase in non-oil domestic exports across key markets.
Tech Components
Semiconductor and integrated circuit trade remains the dominant segment in regional flow.
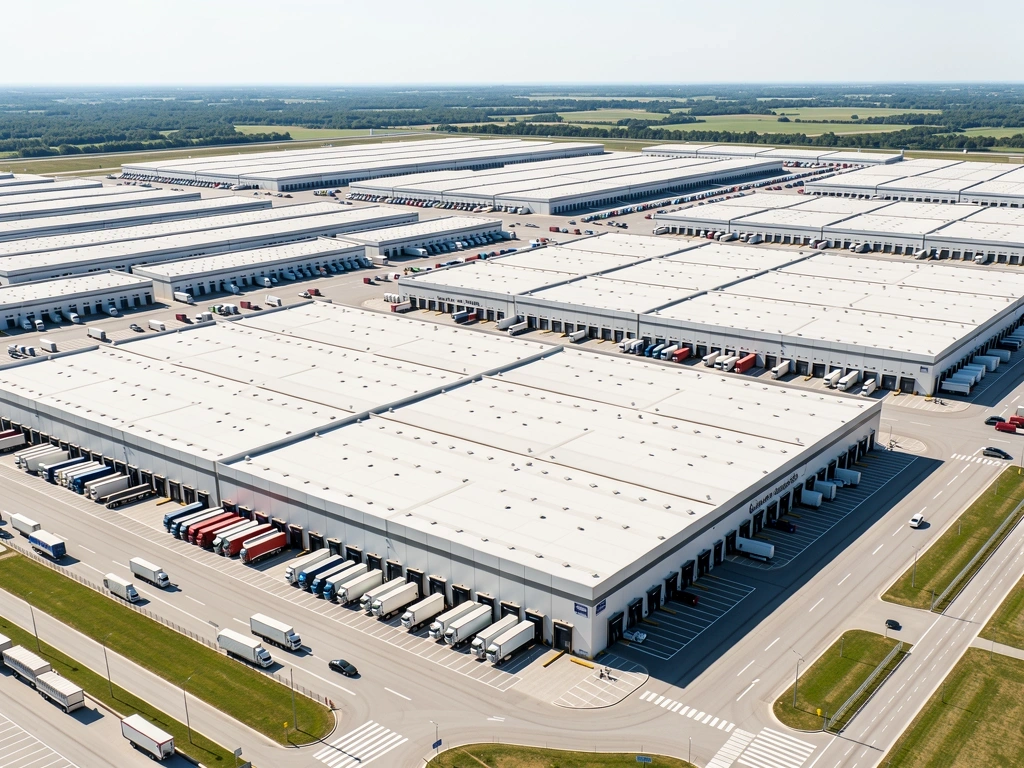
Trade Velocity
Average customs clearance time for digital-first logistics routes in the KL-Singapore corridor.
Where Performance Meets Visibility.
At Singapore Trade Metrics, we distinguish between high-volume noise and high-value signals. Our analytics framework is designed to filter out seasonal anomalies, focusing instead on structural shifts in regional trade. We believe that quality is decided at the point of origin—through rigorous documentation and compliance—while it is only presented at the point of fulfillment.
By tracking specific trade performance indicators, we help partners identify which sectors are experiencing genuine demand growth versus those merely recovering from supply chain disruptions. This distinction is critical for long-term resource allocation and infrastructure investment.
- Real-time customs aggregate monitoring.
- Sub-sector growth benchmarks for SMEs.
Vertical Market Segmentation
Detailed breakdown of trade metrics by primary and secondary industrial sectors within the 2026 fiscal window.

Electronics & Tech
Accounting for nearly 40% of the export profile, this sector is characterized by high trade metrics in both component intake and finished product output.

Biomedical Sciences
A high-margin vertical with complex analytics surrounding temperature-controlled logistics and strict pharmaceutical compliance metrics.
Retail & Consumer
The most volatile metric group, influenced heavily by regional e-commerce trends and seasonal consumer behavior shifts.
Built on Hard Proof.
Our trade metrics are derived from authenticated port logs, customs declarations, and bank-settled trade finance data. We prioritize precision over speed, ensuring all datasets across SingaporeTradeMetrics.digital are verified before publication.
Need a Custom Analytics Suite?
Connect with our trade analysts for a bespoke deep-dive into the metrics that define your specific industry vertical.
KL Center 14, Malaysia
+60 3 3434 5656
Mon-Fri: 09:00-18:00